 Jahangir's World Times First Comprehensive Magazine for students/teachers of competitive exams and general readers as well.

Budget Brief 2019-20
Muhammad Sulaiman
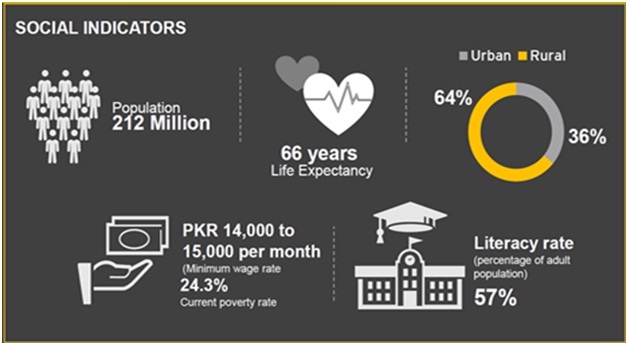
Social Indicators
Facts about Pakistan Economy
- 5th most populous country in the world
- 23rd largest in the world in terms of purchasing power parity (PPP)
- 40th largest in terms of nominal gross domestic product.
- Nominal GDP per capita of $1,357 in 2019 (ranks 154th )
- PPP GDP per capita of 5,839 in 2019(132th)
- Undocumented economy estimated at 36% of overall economy
- Economy is semi-industrialized
Gross Domestic Product (GDP) is a broad measurement of a nation’s overall economic activity. GDP is the monetary value of all the finished goods and services produced within a country’s borders in a specific time period. It includes all private and public consumption, government outlays, investments, additions to private inventories, paid-in construction costs and the foreign balance of trade (exports are added, imports are subtracted).
Gross National Product (GNP), which measures the overall production of an economy’s citizens, including those living abroad, while domestic production by foreigners is excluded.
Sectors of Economy: There are three sectors of Pakistan Economy namely Services, Industry and Agriculture. As per Economic Survey of Pakistan 2018-19 published recently, Services contribute 67.7%, Agriculture contributes 18.5%, and Industry contributes 13.5-13.8% to the country’s GDP.
The year wise growth summary of the three sectors of the economy from Financial Year 2012 to 2018 is given below:
The growth/decline of economy from FY 2016 to FY2020 is shown in figure below:

The provisional GDP growth rate for FY19 is estimated at 3.3%
- Agriculture 0.9%,
- Industry 1.4%
- Services 4.7%
Agricultural sector: The agriculture sector grew by 0.85% compared to 3.81% last year. The crops sector has witnessed negative growth of 4.4% during FY19 against a positive growth of 3.83% during FY18.
Industrial sector: During FY19, the provisional growth in industrial sector has been estimated at 1.40% as compared to 5.8% growth in FY18. This is mainly because of decline in growth to 2.06% (6.13% growth in FY18) in large scale manufacturing (LSM) sector while mining and quarrying sector has witnessed a negative growth of 1.96% (3.04% growth in FY18).
Services sector: Provisional estimates have shown that the services sector posted a growth 4.71% during FY19 against growth of 6.43% in FY18. Wholesale and Retail Trade sector grew at a rate of 3.11% in FY19 versus a growth of 7.51% in FY18. Transport, Storage and Communication sector has registered a growth of 3.34% against growth of 3.58% achieved in FY18.
Federal Receipts
Sources of Federal Receipts (How does the Federal Government generate revenue?)
Federal Expenditure (How does the Federal Government spend?)
Macro-Economic Highlights
- Pakistan’s GDP growth tapered off – Pakistan’s economy slowed down sharply in the current fiscal year, hitting nine-year low at 3.3% and missing the 6.2% target by a wide margin. IMF has forecasted that the Country’s GDP growth will slow down to 2.7% in the following fiscal year.
- Contracting current account deficit – Pakistan’s current account deficit declined to US$ 11.586 billion in July-April FY19 as compared to US$ 15.864 billion in the same period last year showing a contraction of 26.9%. This contraction can be attributed to reduced imports and growth in workers’ remittances during the year.
- Slight decline in trade deficit – During July-April FY19, Pakistan’s trade deficit decreased by US$ 1.879 billion to US$ 23.934 billion in the current fiscal year compared to US$ 25.813 billion in FY18.
- Widening fiscal deficit – During first nine months of FY19, consolidated fiscal indicators performance suggests that total revenue registered zero growth over same period last year, while total expenditures increased by 8.7% for the same period. Therefore, fiscal deficit as percent of GDP reached 5.0% as compared 4.3% in comparable period of last year.
- Average Highlight inflation – Average CPI for the period July-March FY19 was 6.79%, compared to an average of 3.78% for the same period last year. Devaluation of PKR against the greenback and the relative inelasticity of Pakistani imports are major contributors to the hike inflation rate during the year.
- Pakistan’s credit rating – S&P Global Ratings lowered its credit rating for Pakistan on 4th February 2019 to B- from B, partly due to the slow negotiations between the cash-strapped government and the IMF on a financial support deal.
GDP growth, exports, fiscal deficit, revenue generation, inflation and other key indicator were all, well off the mark. The only respite came due to a contraction of current deficit due to higher remittances and lower imports. GDP grew by 3.3% against an ambitious target of 6.3%. Exports surprisingly contracted by 1.3% YoY despite significant currency devaluation. Critically, revenue generation remained flat which aggravated the fiscal deficit. During the (Jul-Mar) period of FY19, total revenues of the government were 9.3% of GDP compared to 10.3% in the same period last fiscal year. This is troubling despite the 18% boost to revenue collection due to higher import duties and currency devaluation. As a consequence, fiscal deficit for FY19 is expected to be approx. 7.0% VS a target of 5%.

Stabilization measures
The government adopted the traditional tools (fiscal and monetary tightening) for curbing aggregate demand. Discount rate increased by 575 basis points during the year. Combined with devaluation and a slew of regulatory duties, the current account deficit (CAD) contracted. FY19E CAD is~4% of GDP compared to 6.1% in FY18. In absolute terms CAD is expected to decline to ~USD 12.5bn compared to USD 19bn in FY18. While fiscal tightening failed to achieve desired results, the Public Sector Development Program (PSDP) expenditures were curtailed significantly and registered a negative growth of 34% YoY. PSDP in absolute terms declined by PKR 337bn in the nine month period and an annualized level of PKR 450bn

Expected Measures
The government is targeting an ambitious GDP growth of 4% for FY20 which contrasts with a more meager 2.7% forecasted by IMF. The government forecast is predicated on the PSDP target of PKR 1.3trn. Historically, the PSDP allocation is used as a balancing number to meet the fiscal deficit targets. Any slippage on the rather difficult PKR 5.5trn revenue target would impact PSDP and consequently, growth.
Much will also depend on the IMF program negotiated by the government. While details of the staff level agreement are yet to emerge, it appears that IMF has insisted on front loading various measures. Additional taxation of around PKR 700bn and increase in tax to GDP by 3.5% over a three year period, reduction in primary deficit, flexible exchange rate mechanism appear to be some of the key conditions. Comparisons of the likely IMF program have been made with Egypt as a benchmark. If that indeed proves to be the case then currency devaluation will become a regular feature during the tenure of the IMF program. Electricity and gas prices will also be raised to allow for full cost recovery and elimination of circular debt. Exchange rate depreciation and utility price increases will lead to a further increase in inflation in FY20. However, inflation is expected to moderate in the medium term due to base effect.
Solutions to Pakistan’s problems and frequent boom bust cycles have been evident for a while. Bridging the savings investments gap, increase in exports, curtailing non-productive expenditures, reducing the losses of PSEs or outright divesting them etc. However, the will to implement these reforms has been lacking. Many successive governments have undertaken stabilization measures half-heartedly at the start of their tenure and then resorted to fiscal profligacy when the situation permits and certainly before a new election. IMF programs in the past have also been more accommodative (Pakistan’s geostrategic importance has led to waivers on various KPIs and the external imbalances were not as critical).
Key Indicators of Economy
- Fiscal deficit: Earning – Expenditure (it also includes other liabilities and payments due on part of government)
- Budget deficit: Government spending more than it is earning
- Current Account Deficit: Exports – Imports (it also includes other payments other than imports)
- Trade deficit: Imports are greater than exports
T rade deficit:
► Pakistan’s trade deficit was recorded at $23.934bn with a ~7.3% reduction during the first ten months of FY19. Exports decreased slightly to $20.01bn during 10MFY19 compared to US$ 20.49bn in the corresponding period of FY18. Meanwhile, imports were recorded at $44.03bn, a contraction by ~4.9% compared to the same period last year.
► The trade balance has remained stable during 10MFY19 as trade deficit decreased by US$ 1.879 billion to US$ 23.934 billion in the current fiscal year compared to US$ 25.813 billion in FY18. Imports have decreased and more worryingly so has exports. Pakistan should concentrate its efforts towards export led growth to effectively tackle the crises of trade deficit. Otherwise, this stability in balance of trade will be temporary and is likely to reverse in the future.
► The key commodities contributing to the curtailment of the trade deficit were Furnace Oil (Mineral Products), Base Metals, and Machinery and mechanical appliances. These are discussed in more detail below:
- The imposition of ban on import of furnace oil has yielded positive results as imported mineral products shown a 17% increase in the current fiscal year compared to a growth of 30% in the same period last year. During 8MFY19, Iron and Steel imports witnessed a ~10% decline on the back of the Government imposed antidumping Duty (ADD) on top of already imposed regulatory duties on finished steel products.
- A significant increase in import last year was reported in capital goods such as steam and gas-turbines, electric transformers, parts of auxiliary power plants and other equipment. During 8MFY19, Machinery and Mechanical Appliances made up ~10% of the imports, saw a 23% reduction in import payments as CPEC moves to Phase-II.
- During the period Jul-May 2019 PKR devalued by around 30% against USD. The currency has been devalued by ~25% against USD in 2018. The impact of recent Rupee depreciation will be witnessed in more positive results in exports in the following months.
Inflation is defined as an increase in the price of commodities. Briefly stated it is more money chasing the same amount of goods as the price gets inflated.

